SAT — Scholastic Assessment Test (Digital SAT)
SAT Math — Problem-Solving and Data Analysis, Set 2
Take the SAT Math — Problem-Solving and Data Analysis, Set 2: 20 multiple-choice questions (30 minutes) with instant scoring and a full answer review.…
What this test covers
- 20 SAT Math
Sample questions with answers
The first 5 questions of this test, with the correct answer and explanation.
Q1. An $80 jacket is discounted by 15%, and then a further 10% is taken off the sale price. What is the final price?
- A. $60.00
- B. $62.00
- C. $68.00
- D. $61.20 ✓
Answer: D. $61.20
Explanation: 80 × 0.85 × 0.90 = 61.20. (Taking 25% off at once would give 60.)
Q2. A town's population falls from 1,200 to 900. What is the percent decrease?
- A. 75%
- B. 25% ✓
- C. 33.3%
- D. 30%
Answer: B. 25%
Explanation: 300 ÷ 1200 = 0.25 = 25%.
Q3. A recipe for 4 people uses 300 g of flour. How much flour is needed for 10 people?
- A. 3000 g
- B. 750 g ✓
- C. 600 g
- D. 1200 g
Answer: B. 750 g
Explanation: 300 ÷ 4 = 75 g per person; 75 × 10 = 750 g.
Q4. A typist types 240 words in 4 minutes. At the same rate, how many words in 15 minutes?
- A. 960
- B. 60
- C. 900 ✓
- D. 3600
Answer: C. 900
Explanation: 60 words per minute × 15 = 900.
Q5. The mean of five numbers is 12. Four of them are 10, 11, 13 and 15. What is the fifth?
- A. 12
- B. 13
- C. 11 ✓
- D. 9
Answer: C. 11
Explanation: The total is 5 × 12 = 60, and 60 − 49 = 11.
The other 15 questions
Take the timed test (free, no sign-up) to see your score and the answer and explanation for every question.
Q6. What is the median of 2, 8, 3, 9, 5 and 7?
- A. 5
- B. 7
- C. 6
- D. 5.7
Q7. What is the mode of 3, 4, 4, 6, 7, 7, 7, 9?
- A. 6
- B. 7
- C. 5.9
- D. 4
Q8. In a class of 60, there are 35 girls, and 14 of the girls prefer science. What is the probability that a randomly chosen girl prefers science?
- A. 0.4
- B. 0.23
- C. 0.58
- D. 0.14
Q9. A card is drawn from a standard 52-card deck. What is the probability that it is a heart?
- A. 1/2
- B. 1/52
- C. 1/13
- D. 1/4
Q10. A spinner has 10 equal sections numbered 1 to 10. What is the probability of landing on a multiple of 3?
- A. 3/10
- B. 2/5
- C. 1/3
- D. 1/10
Q11. A block has a mass of 600 g and a volume of 200 cm³. What is its density?
- A. 0.33 g/cm³
- B. 120 g/cm³
- C. 400 g/cm³
- D. 3 g/cm³
Q12. Convert 30 metres per second to kilometres per hour.
- A. 30 km/h
- B. 1800 km/h
- C. 50 km/h
- D. 108 km/h
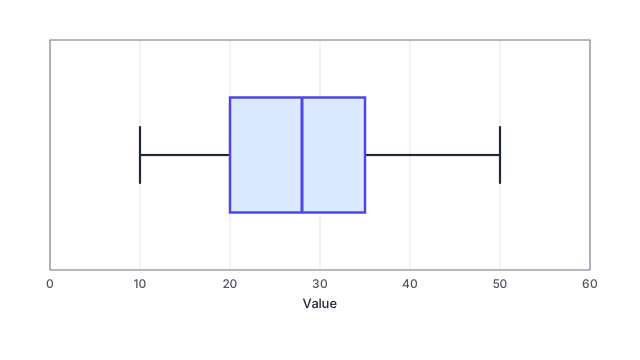
Q13. The figure shows a box plot. What is the interquartile range?
- A. 40
- B. 28
- C. 15
- D. 8
Q14. Using the same box plot, what is the range of the data?
- A. 40
- B. 15
- C. 50
- D. 25
Q15. A table shows y = 5, 10, 20, 40 when x = 0, 1, 2, 3. Which kind of model fits best?
- A. Exponential, because y doubles each time x increases by 1
- B. Linear, because y increases by the same amount each time
- C. Quadratic, because y = x²
- D. Linear, because y increases by 5 each time
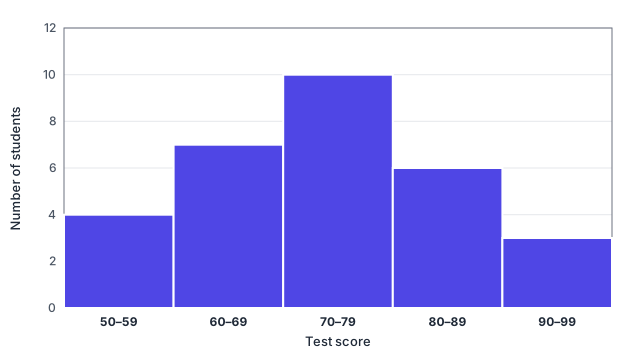
Q16. The histogram shows the scores of 30 students. How many scored 70 or more?
- A. 23
- B. 10
- C. 19
- D. 16
Q17. Using the same histogram, what fraction of the 30 students scored below 60?
- A. 2/15
- B. 7/30
- C. 1/5
- D. 4/7
Q18. A survey of 50 randomly chosen students at one school found that 70% walk to school. To which group can this result most reasonably be applied?
- A. All students in the country
- B. All students in the city
- C. Only the 50 students surveyed and no one else
- D. Students at that school
Q19. 18 is what percent of 72?
- A. 40%
- B. 25%
- C. 54%
- D. 18%
Q20. Class A (20 students) has a mean score of 70, and class B (30 students) has a mean of 80. What is the mean of all 50 students?
- A. 74
- B. 76
- C. 75
- D. 78