SAT — Scholastic Assessment Test (Digital SAT)
SAT Math — Problem-Solving and Data Analysis, Set 1
Take the SAT Math — Problem-Solving and Data Analysis, Set 1: 20 multiple-choice questions (30 minutes) with instant scoring and a full answer review.…
What this test covers
- 20 SAT Math
Sample questions with answers
The first 5 questions of this test, with the correct answer and explanation.
Q1. A $40 shirt is discounted by 25%. What is the sale price?
- A. $10
- B. $15
- C. $35
- D. $30 ✓
Answer: D. $30
Explanation: 25% of 40 is 10, so the price is 40 − 10 = 30.
Q2. A price rises from $50 to $60. What is the percent increase?
- A. 10%
- B. 20% ✓
- C. 60%
- D. 16.7%
Answer: B. 20%
Explanation: Increase ÷ original = 10/50 = 0.20 = 20%.
Q3. The ratio of boys to girls in a class of 40 is 3 : 5. How many boys are there?
- A. 25
- B. 24
- C. 15 ✓
- D. 12
Answer: C. 15
Explanation: 3 parts out of 8: 40 · 3/8 = 15.
Q4. A car travels 150 miles in 2.5 hours. What is its average speed, in miles per hour?
- A. 60 ✓
- B. 375
- C. 62.5
- D. 50
Answer: A. 60
Explanation: 150 ÷ 2.5 = 60 miles per hour.
Q5. What is the mean of 4, 8, 10 and 14?
- A. 36
- B. 8
- C. 9 ✓
- D. 10
Answer: C. 9
Explanation: Sum 36 divided by 4 values = 9.
The other 15 questions
Take the timed test (free, no sign-up) to see your score and the answer and explanation for every question.
Q6. What is the median of 3, 9, 4, 7 and 12?
- A. 4
- B. 9
- C. 7.4
- D. 7
Q7. The value 100 is added to the data set {5, 6, 7, 8}. What happens?
- A. The mean increases much more than the median
- B. Both increase by the same amount
- C. Neither changes
- D. The median increases much more than the mean
Q8. What is the range of 12, 5, 20 and 9?
- A. 15
- B. 20
- C. 8
- D. 11.5
Q9. A fair six-sided die is rolled once. What is the probability of an even number?
- A. 1/2
- B. 1/3
- C. 2/3
- D. 1/6
Q10. A bag has 3 red, 5 blue and 2 green marbles. What is the probability that a random marble is blue?
- A. 5/7
- B. 1/5
- C. 3/10
- D. 1/2
Q11. Of 80 students, 30 play cricket, and 12 of those also play football. What is the probability that a cricket player also plays football?
- A. 0.25
- B. 0.375
- C. 0.15
- D. 0.4
Q12. There are 12 inches in a foot. How many inches are in 7.5 feet?
- A. 84
- B. 19.5
- C. 90
- D. 87.5
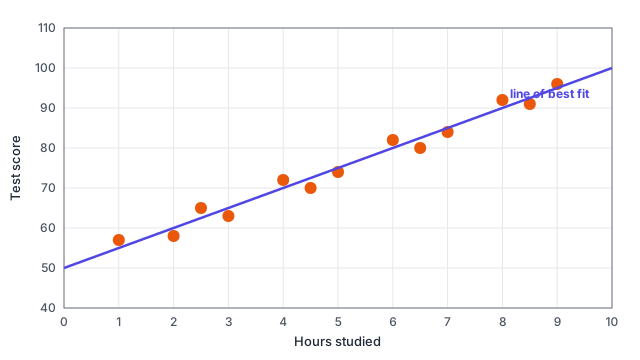
Q13. The figure shows a line of best fit through (0, 50) and (10, 100). What score does it predict for a student who studies 8 hours?
- A. 80
- B. 90
- C. 95
- D. 85
Q14. In the figure, what does the slope of the line of best fit mean?
- A. Each extra point needs about 5 more hours
- B. Scores are 5 times the hours studied
- C. A student who does not study scores 5 points
- D. Each extra hour studied is associated with about 5 more points
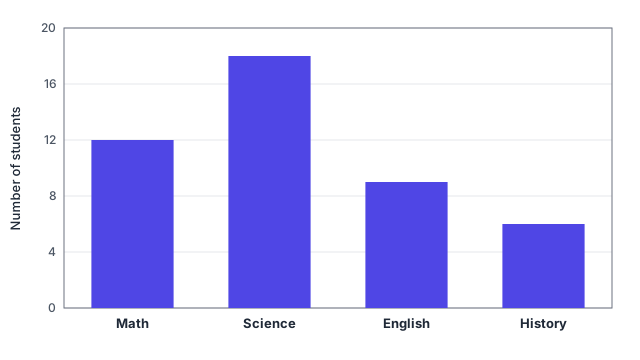
Q15. The bar chart shows the favourite subjects of a group of students. What percentage chose Science?
- A. 40%
- B. 45%
- C. 36%
- D. 18%
Q16. In the bar chart, how many more students chose Science than English?
- A. 12
- B. 9
- C. 18
- D. 6
Q17. What is the simple interest on $1,000 at 4% per year for 3 years?
- A. $1,120
- B. $124.86
- C. $120
- D. $40
Q18. 12 workers can paint a building in 6 days. Working at the same rate, how many days would 9 workers take?
- A. 9
- B. 8
- C. 7
- D. 4.5
Q19. A random sample of 500 voters found that 60% support a proposal, with a margin of error of 4%. Which conclusion is best supported?
- A. At least 64% of all voters support the proposal
- B. Exactly 60% of all voters support the proposal
- C. Between about 56% and 64% of all voters likely support the proposal
- D. The proposal will certainly pass
Q20. Which data set has the greater standard deviation: A = {10, 10, 10, 10} or B = {5, 10, 15, 20}?
- A. They are equal
- B. B
- C. It cannot be determined
- D. A